#1 Dig The Data
" When data is organized in a chart it is much easier to decide what the data is actually telling you."
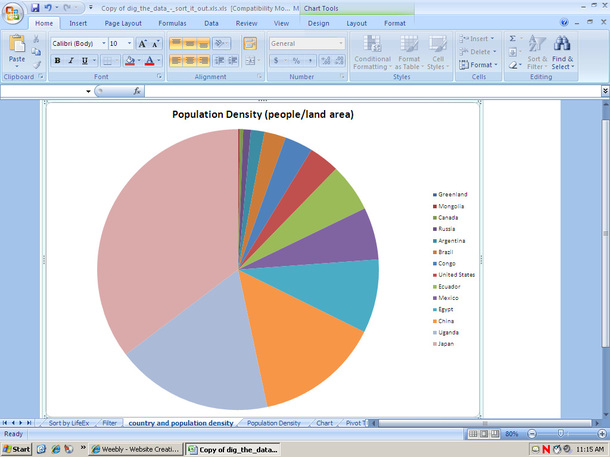
Cell Phone Usage in Minutes

Text Messages

Nets
1.a Apply existing knowledge to generate new ideas, products, or processes. 1.b Create original works as a means of personal or group expression. 4.a Identify and define authentic problems and significant questions for investigation. 4.b Plan and manage activities to develop a solution or complete a project. 4.c Collect and analyze data to identify solutions and/or make informed decisions. 4.d Use multiple processes and diverse perspectives to explore alternative solutions. 6.b Select and use applications effectively and productively.
From my bar graphs I can tell that Susie Smith texts about the same amount every month during the school year. In the summer months, like June, July, and August she texts way more because she is out of school. Also I see that during school months her texts are around the eight hundreds and nine hundreds.These are a few things I have learned about Susie Smith and her texting.
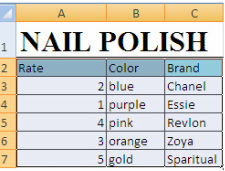
Excell Chart Before Sorting
Excell Chart After Sorting from A-Z
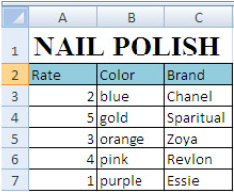
You could use a spreadsheet to organize things such as nail polish, animals. or video games. Some categories you could use for nail polish are color, brand, and rate which one you like best. The collection that i have is nail polish. When you make a spreadsheet about nail polish you could use the sort feature by putting the colors you choose in alphebetical order. You could use the filter feature by getting rid of a section, such as the rate, if you only wanted the color and brand. The type of chart I think might be helpful to create my coolection is a pie chart.
